Performance Monitoring and Current Host Rendering Settings
What they do
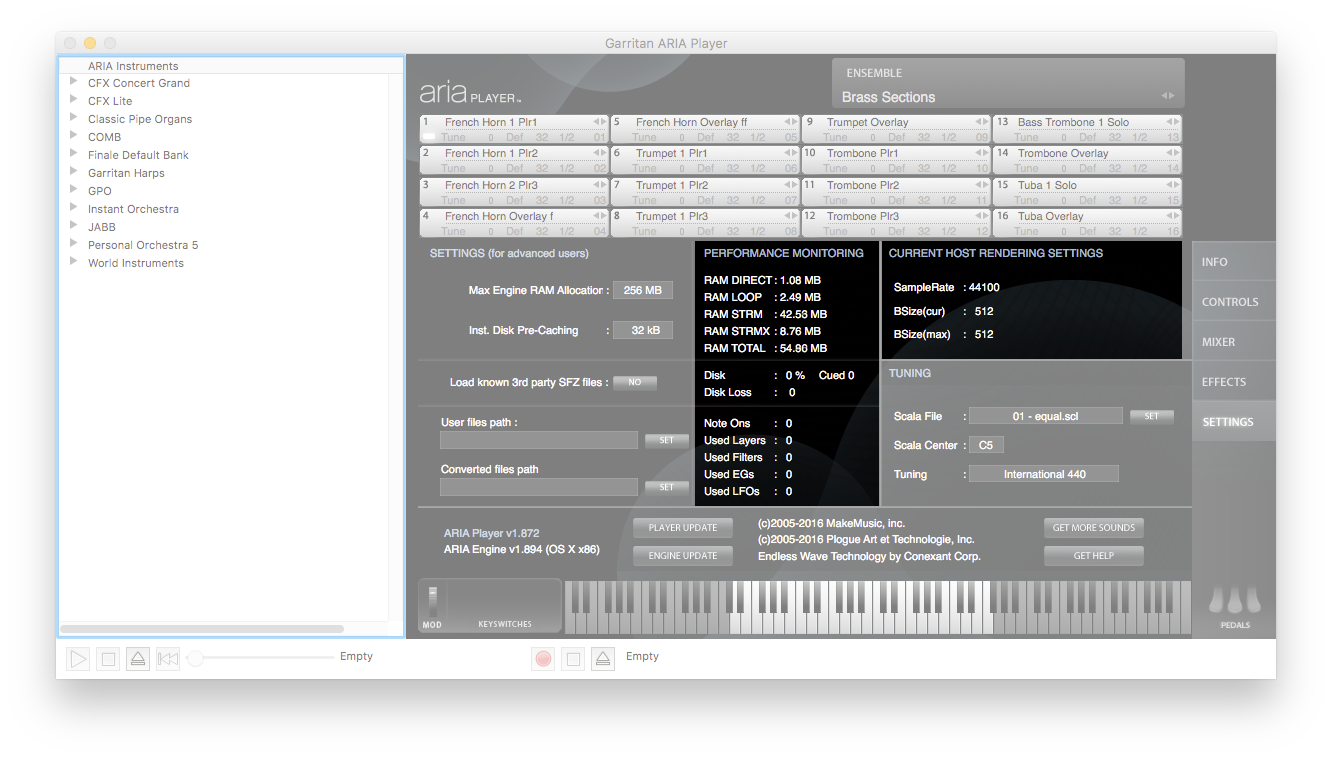
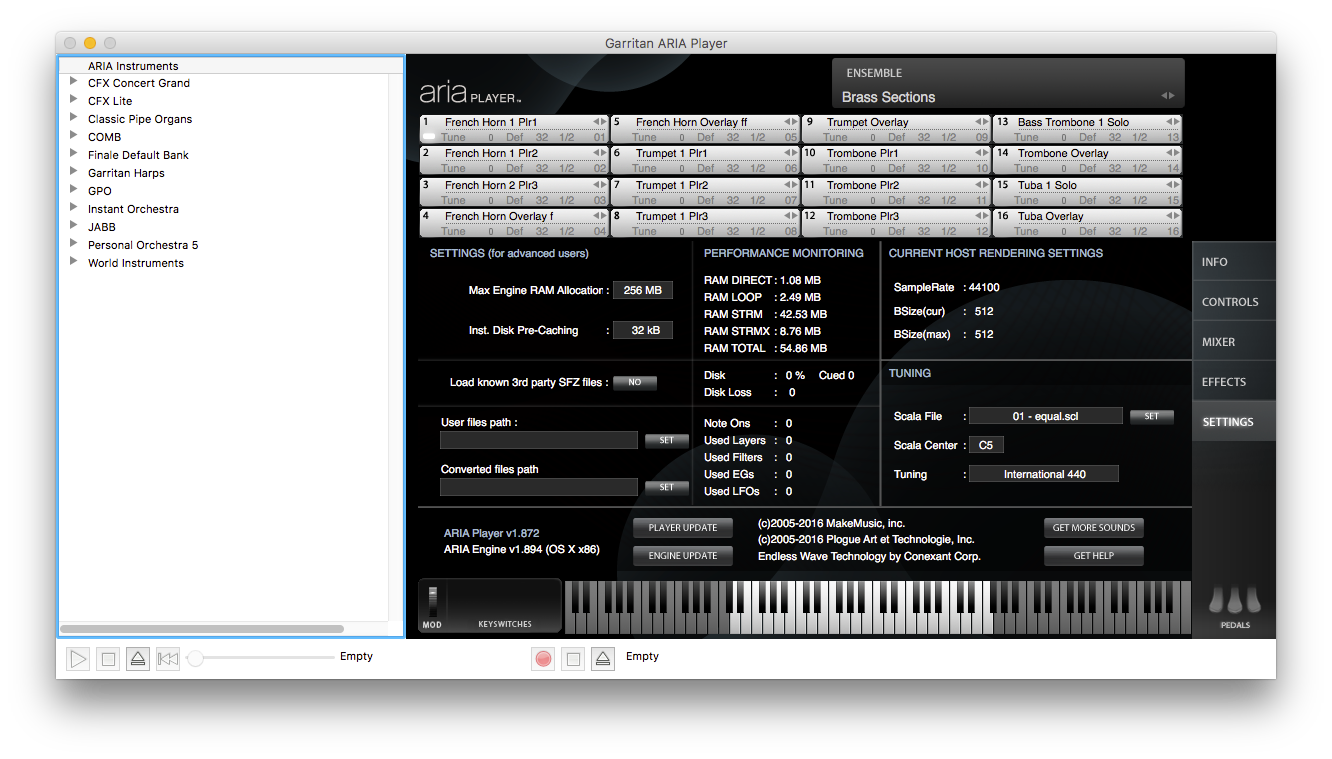
The Performance Monitoring section within the Settings view displays important information about the system performance. Statistics about the ARIA Player and your computer are listed in the section in real-time to provide a glimpse into performance and resource usage.
- RAM DIRECT • RAM LOOP • RAM STRM • RAM STRMX • RAM TOTAL. These values indicate the overall RAM usage of the ARIA Engine.
- Disk • Disk Loss. Displays information about the overall disk efficiency of the ARIA Engine.
- Note Ons • Used Layers • Used Filters • Used EGs • Used LFOs. These values indicate the number of samples currently sounding, corresponding to the MIDI events occurring in real-time. Much of this information is specific to the programming of each individual instrument patch, represented here as a sum total for all patches and notes currently being played.
In the Current Host Rendering Settings section, SampleRate displays the sample rateA measurement of how many individual audio samples occur per second. In general, the higher the sample rate, the better the sound quality. Common computer sample rates are 44,100 Hz (44.1 kHz) and 48,000 Hz (48 kHz). currently in use. When using the standalone player, set the sample rate in Preferences. When using the ARIA Player as a plug-in, the sample rate is set by your DAW or hostAudio or notation software that makes use of virtual instrument plug-ins. When the ARIA Player is used as a plug-in, your audio or notation software hosts it. program. Available sample rate choices are determined by the sound card or audio interface in use. BSize(cur) and BSize(max) displays the current bufferA temporary storage location for audio information. In general, larger buffer sizes create a smoother sound due to using more memory. This unavoidably increases latency as well. size. Like the sample rate, the buffer size is set either in Preferences or in the host program.
To monitor ARIA Player performance
- Click the Settings button. The Settings view appears.
- In the section labeled Performance Monitoring, the first five items represent RAM usage, the middle two represent disk efficiency, and the final five represent MIDI events. All sections are updated in real-time as you use the ARIA Player.
Leave feedback on this topic
ARIA Player User Manual
Copyright and trademarks

